New version of Mendeley Suggest has been released. It’s in Beta so please do give feedback!
A Practical Guide to Building Recommender Systems
Mendeley Suggest is an article recommender system for researchers. It’s designed to help them discover new research based on their short and long term interests and to keep them up-to-date with what’s popular and trending in their domains.
The first set of recommendations is based on all of the articles that you have added to your personal library in Mendeley. These recommendations are very good for me, as much of my recent work has been on recommender systems.
 Recommendations based on all articles in your personal Mendeley library
The second set of recommendations is based on activity in Mendeley’s community. It recommends articles that are important in your domain but not necessarily related to your immediate interests. It’s a nice tool for helping researchers to keep up-to-date with position papers and reviews that have made an impact in your broader domain which, in my case, is Computer Science.
 Recommendations…
View original post 358 more words

Introduction
Twitter recently introduced some new functionality. Now you can create polls that stay open for 24 hours and allow you to tap into the Twitter community to get some answers to your burning questions. Anyone on Twitter can vote for one of the two options in the poll and their choice remains anonymous. I thought I’d have a little fun with them.
First a Few Words about how I use Twitter
Out of all of the tools that I use to keep up-to-date with what’s going on in the world of work, Twitter has to be the tool that I rely on the most. I never use Twitter’s main site, other than to check out analytics from time to time, but I regularly use Tweetdeck to keep on top of several topics at a glance.

Tweetdeck lets you follow multiple Twitter streams at the same time.
When I want more of a summary of interesting articles being tweeted on a particular topic I also dip into Right Relevance to see what’s happening.

Right Relevance helps you to find articles and people on Twitter relevant to your interests.
I also like to contribute to Twitter and tweet quite regularly. I find it’s a great way to release random thoughts. Crowdfire really helped me to find interesting people to follow and build up my own network.
Now on to the Polls
The first poll that I created was about Data Science. In particular, it was about the job title of Data Scientist. Are people happy with their Data Scientist titles?
Interestingly, only 55% of the respondents like their title. Perhaps Data Scientist isn’t the sexiest job of the 21st century any longer. I love my job but this fits with what I’ve recently seen in the community. I increasingly see data science professionals from a range of companies becoming frustrated by the lack of clear meaning in their job title. There are several roles that data scientists play (this recent study from Bob Hayes goes into detail) and lumping them all together as if they are one isn’t helpful. It can also lead to envy and resentment across teams where one kind of data scientist is doing a very different job from another although upper management sees their contributions are equal. Or, similarly, the same title means very different things in different companies and makes it hard to know what you’re dealing with when you see it on someone’s CV.
That result was interesting enough to encourage me to play more. This time, I sent out a much more provocative poll to see what would happen.
This one got over double the respondents, 48 people voted for it over 20 for the first one. Looks like I’m not alone in thinking that LinkedIn has a problem with recruiters.
I then went back to the topic of Data Science. I was surprised in Bob Hayes’ study about Data Science roles that so few of them had a lot of knowledge about Machine Learning. For me, machine learning is central to this job. So, I opened up a new poll.
46 votes and a resounding yes with 80%. So, although I don’t know who answered the poll, it looks like they have the same expectation as I do that Data Scientists should be experts in Machine Learning.
As a follow up from the first poll about whether Data Scientists like their job title, I then got to thinking that perhaps there’s a mismatch between what employees expect a Data Science job to be and what employers advertise as a Data Science job.
It turns out that people don’t think that Data Science job adverts describe the role well. This might also be a reason for some of the unrest in the Data Science community. It’s hard to keep good people if you aren’t clear and honest about what they will be working on during the interview process.
Finally, I wasn’t sure if the results of Twitter polls could really be trusted so I put it to the vote.
At the time of writing this post, the poll is still ongoing. I wonder what the answer will be?
Are these Poll Results Credible?
In a word, no. Anyone who knows the first thing about creating polls and surveys will know not to put much stock in the results of these polls. There’s plenty of selection bias going on, no way to tell what the demographics of the respondents were, no way to ensure if the respondents were eligible to answer, no way to follow up and dig deeper and only a small number of respondents replied. Some of these problems are particular to this test but others will apply generally to Twitter polls casting doubt on their general usefulness.
Let’s not let science get in the way of a little fun though.
Conclusion
Twitter polls are great, I’m addicted already! I think I’m going to enjoy playing with them over the next few months. I’ll be taking all of the results with a substantial helping of salt but hey, it’s fun.
Finally, as if it were planned. I just noticed that I have sent 1,499 tweets so far. That’ll make my next tweet, which will be about this blog post, the big 1,500! Thanks Twitter!

High level Twitter statistics for my profile.
Introduction
There’s something big happening in the world of technology. Over the past couple of years there’s been a resurgent interest in neural networks and excitement over the challenging problems that they can now solve. Folks are talking about Deep Learning… I’ve been keeping an eye on what’s happening in the field to see if there’s anything that we can use to build better tools for researchers here at Mendeley. Recently I went along to the Re-Work’s Deep Learning Summit and thought I’d share my experiences of it here.
The Deep Learning Summit
The 300 attendees were mainly a mixture of technology enthusiasts, machine learning practitioners and data scientists, who all share an interest in what can be done uniquely with deep learning. We heard from around 50 speakers, over two days explaining how they are using deep learning. There were lighting talks, normals ones with Q&A and some fireplace chats. There were lots of questions, chief amongst them being ‘What is deep learning?’, and some notable highlights.
Some Highlights
Paul Murphy, CEO of Clarify, gave a brief history of deep learning. While neural networks were popular in the 1980s, they went out of fashion for a couple of decades as other techniques were shown to outperform them. They were great at solving toy world problems but beyond some applications, such as automatic hand-writing recognition, they had difficulty in gaining traction in other areas. Yann LeCun, Yoshua Bengio, Geoffrey Hinton, and many others persevered with neural network research and, with the increase in computational processing power, more data and a number of algorithmic improvements, have shown that they can now outperform the state-of-the-art in several fields including speech recognition, visual object recognition and object detection. Deep Learning was born.

The players on the stage of #DeepLearning – @AndrewYNg @geoff_hinton @ylecun
There was an interesting fireside chat with Ben Medlock (@Ben_Medlock) from SwiftKey, the productivity tool that predicts the next word you’re about to type to save you time. I love this app. Ben spoke about the challenges involved in natural language processing and how many of the current syntactic approaches don’t exploit the semantics of the sentences. This is where deep learning comes in. Using tools like word2vec, you can compare words in a semantic space and use that to improve text prediction. He spoke about how they have done some work with recurrent neural networks, possibly the deepest of deep learning, to improve their tools.
A lot of the work presented was in the area of vision. This is a field in which deep learning has made consistent advances. Matthew Zeiler presented some impressive demos from Clarifai. They take videos and automatically tag them with concept tags in real-time, from a selection of over 10,000 tags. They report that deep learning has significantly improved the quality of results here. It’s available through their API as a service and they already have a number of high profile customers such as vimeo, vodafone and trivago.


Some early work on neural turing machines also peaked my interest. Alex Graves, from Google DeepMind, told us that modern machine learning is good at finding statistics. For example, you can train a network model to give you the probability of an image, given a label, or the probability of some text given some audio, but the techniques behind them don’t tend to generalise very far. To improve them, the usual solution is to make better representations of the data, such as making the representations more spare or disentangling them into different factors. Neural turing machines offer another solution where instead of learning statistical patterns, they learn programs. These programs are made up of all of the usual things that programming languages provide like variables, routines, subroutines and indirection. The main advantage of this is that these machines are good at solving problems where the solutions fit well into algorithmic structures. I assume that this also makes the solutions much more readable, adding some transparency to the typical black box solutions.
Finally, a fun one but certainly with serious science behind it. Korey Kavukcuoglu, also from Google DeepMind, spoke about their agent-based systems that use deep learning to learn how to play Atari games. For him, deep learning takes us from solving narrow AI problems to general AI. He showed that through using reinforcement learning, where agents learn from observations in their (simulated) environments and are not given explicit goals, they trained Deep Q networks (convolutional neural networks) to play a number of Atari games. In several games they perform with human-like performance and even go beyond in some cases. They built this using Gorila, Google’s reinforcement learning architecture, designed to help scale up deep learning to be applied to real-world problems.
Conclusions
Deep Learning is not just hype, which was one of my worries before going to the summit. It clearly can solve lots of real-world problems with a level of accuracy that we haven’t seen before. I’ve kicked off a few hacks and spikes to explore what we can build for Mendeley’s users using some of these techniques. If we get good results then expect Deep Learning to be powering some of our features soon!
With this first post I’m going to introduce Mendeley Research Maps. At Mendeley we have monthly hackdays when we can experiment with new technologies, work on side projects or simply learn something new and have fun. During one of my first hackdays I started to work at a two dimensional visualisation of research interests, inspired by an idea suggested to me by a good friend and future colleague, Davide Magatti. The first hack produced the following visualisation:
 First draft of the Discipline Map
In this picture disciplines are arranged on the map based on how related they are: medicine is very broad and close to many other disciplines, such as biology and psychology. In the opposite corner computer science is close to engineering and economics. From this first draft I started to build a web application for Mendeley users, using the Mendeley Python SDK for querying the Mendeley API, Flask as a web framework, CherryPy
View original post 1,144 more words
Introduction
Imagine that you’re a researcher and you’ve just found an article that’s really useful for you. It asks lots of the questions that you’ve been asking and even gives some interesting answers. How can you find other articles that are related to that one?
I’ve been working with some top researchers (Roman Kern and Michael Granitzer) on trying to build a system that helps solve this problem. Given any of the millions of articles in Mendeley’s Research Catalogue, can we automatically propose other articles that are related to the one you’re reading? We currently try to do this for Mendeley users by recommending related research (Figure 1).

Figure 1: Related research for an article in Mendeley’s catalogue.
Alternative Solutions
This is a pretty common problem in the fields of Information Retrieval and Information Filtering. Many search engines have built-in features that support it, like Lucene’s MoreLikeThis, and it’s also commonplace in recommender systems, like Mahout’s ItemSimilarity. There are three basic approaches to solving this problem:
- Take the content of the research article (e.g. title, abstract) and try to find other articles that have similar content. This is often called a content-based approach.
- Look at who reads the research article and try to find other articles that are also read by these people. This tends to be called a collaborative filtering approach.
- Use both the content and usage data (i.e. who reads what) into account to find related articles. Unsurprisingly, this gets called a hybrid approach.
We can set up a few experiments that use each of these approaches as we have all of the data that we need at Mendeley. In terms of content, we have the metadata for millions of research articles and in terms of usage data, we can look at reading patterns throughout Mendeley’s community. It’ll be interesting to see which approach gives the best results.
Experiment
We set up an experiment to compare content-based, collaborative filtering and hybrid approaches to retrieving related research articles. First off, like in many experiments, we need to have a data set that already tells us which articles are related to which other articles, so that we can use this to evaluate against. While we don’t know how all articles are related to one another (if we did then we wouldn’t need to build a system that tries to automatically find related articles) we do have some data for a subset of these relationships. Namely, we can look at which articles researchers add to publicly accessible groups on Mendeley and make the assumption that any two articles that appear in the same group together are more likely to be related to one another than any two articles that do not appear in the same group together. Ok, this isn’t perfect but it’s a good evaluation set for us to use to compare different approaches.
We then set up three systems, one for each approach, that we’ll call content-based, usage-based (i.e. collaborative filtering approach) and hybrid. To test them we select a random sample of articles from the publicly available Mendeley groups and, for each one, requested that the three systems return an ordered list of five articles that were most related to them. If an article returned was related to the article input into the system (i.e. they both appear in a public group together) then this counts as a correct guess for the system. Otherwise, the guess is judged as incorrect.
Results
The relative accuracy of the three approaches can be seen in Figure 2. Here, accuracy is a measure of the average number of correctly retrieved related articles over all tests (average precision@5). The content-based approach performs worst, retrieving just under 2/5 related articles on average (0.361); the usage-based approach doesn’t perform much better, retrieving around 2/5 related articles on average (0.407); while the hybrid approach performs best, retrieving just under 3/5 related articles on average (0.578).

Figure 2: Comparison of three approaches to retrieving related research. Each approach could retrieve a maximum of five correct results.
These results are interesting. From an information retrieval perspective, given that research articles are rich in content, it’s reasonable to assume that a content-based approach would perform very well. This rich content only allows us to retrieve around two relevant articles out of five attempts. This seems quite low. From a recommender systems perspective, it’s common for usage-based approaches to outperform content-based ones, but the results here do not indicate that there is a big difference between them. Perhaps the content is, in fact, rich enough here to be a reasonable competitor for usage-based approaches.
The clear winner, however, is the hybrid approach. By combining together content-based and usage-based approaches, we can see significant gains. This suggests that the information being exploited by these two approaches is not the same, which is why we can get better accuracy when we combine them.
Conclusion
The question raised in the title is whether content is still king or if usage has usurped it. In this study, when we try to automatically recommend related research literature, content-based and usage-based approaches produce roughly the same quality of results. In other words, usage has not usurped content. Interestingly, however, when we combine content and usage data, we can produce a new system that performs better than using just one of the data sources alone.
This is a very high level take on the work that we have done. For those of you who’d like more details, a write up has been published in Recommending Scientific Literature: Comparing Use-Cases and Algorithms.
Authors: Phil Gooch and Kris Jack
Introduction
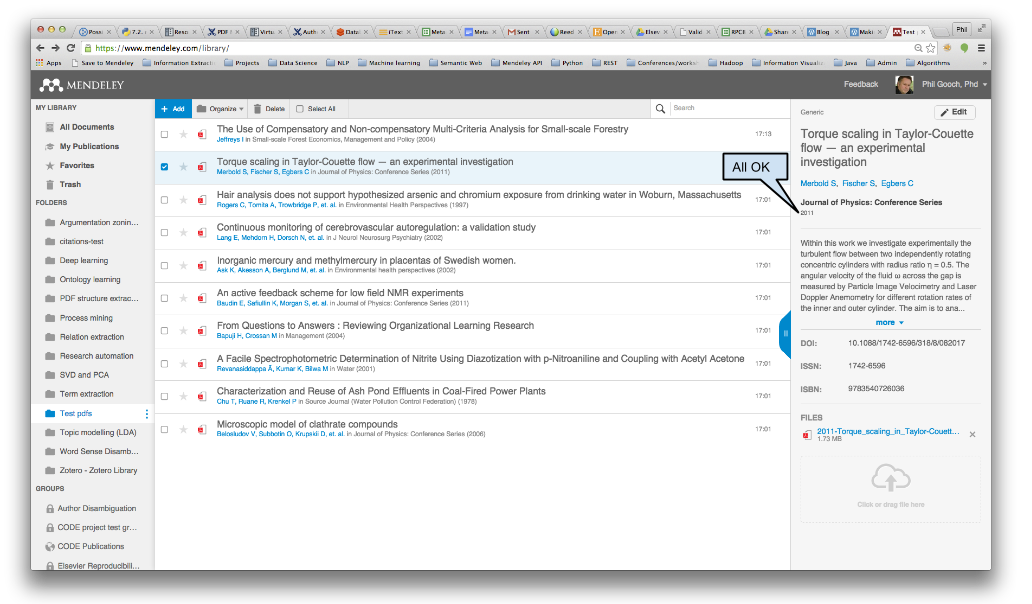
One of the most used features at Mendeley is our metadata extraction tool. We’ve recently developed a new service that tries to automatically pull out the metadata from research article PDFs. This is currently used by the new Mendeley Web Library and iOS applications (Figure 1). We’re often asked how well it works so we thought we’d put this short post together to answer that question.
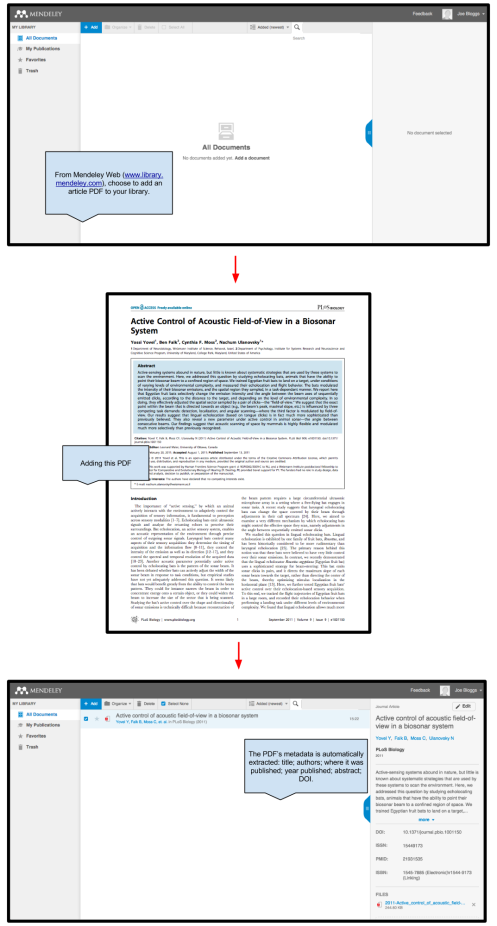
- Figure 1. Steps in metadata extraction in Mendeley Library. Step 1, add a PDF. Step 2, wait a second for the metadata to be extracted. Step 3, see the extracted metadata.

The Problem
Automated metadata extraction is one of those problems in AI that appears very easy to solve but is actually quite difficult. Given a research article, that has been well formatted by a publisher, normally it’s easy to spot key metadata such as its title, the authors, where it was published and when it was published. The fact that publishers use a diverse range of layouts and type settings for articles isn’t a problem for human readers.
For example, the five articles in Figure 2 all have titles but in each case they appear in different positions, are surrounded by different text and are in different fonts. Despite this, humans find it very easy to locate and read the titles in each case. For machines, however, this is quite a challenge.

- Figure 2: Five Articles with Different Layouts. The titles in each article have been highlighted. They all appear in different positions, are surrounded by different text and are rendered in different fonts.

At Mendeley, we have been working on building a tool that can automatically extract metadata from research articles. Our tool needs to be able to help researchers from any discipline of research, meaning that we need to be able to cope with PDFs across the full range of diverse styles that publishers have created. In the next section, we’ll look at the metadata extraction tool that we have developed to address this problem.
The Solution: Metadata Extraction
The metadata extraction tool takes a PDF as input and produces a structured record of metadata (e.g. title, authors, year of publication) as output (Figure 3).

- Figure 3: Simplified Metadata Extraction Architecture

In this section, we’re going to open up the bonnet of the metadata extraction tool to reveal that it’s actually a pipeline of several components that depend on one another (Figure 4):
- We take the PDF
- Convert to text: pdftoxml extracts text from the PDF into a format that provides the size, font and position of every character on the page.
- Extract metadata: This information is converted into features that can be understood by a classifier that decides whether a sequence of characters represents the title, the author list, the abstract or something else. Once the classifier has determined which bits of text are the relevant metadata fields, the fields are cleaned up to make them more presentable. The text conversion and metadata extraction components are wrapped up in an open-source tool called Grobid, which we have modified so that it can be integrated easily with our codebase.
- Enrich with catalogue metadata: The extracted fields are used to generate a query to the Mendeley metadata lookup API. If we find a match in the Mendeley Catalogue, then we can use its metadata or we can return the metadata that was directed extracted. In this way, if we can enrich the extracted metadata with information from the Mendeley Catalogue then we do, otherwise, we return what we were able to extract without enriching it.
- You get the metadata
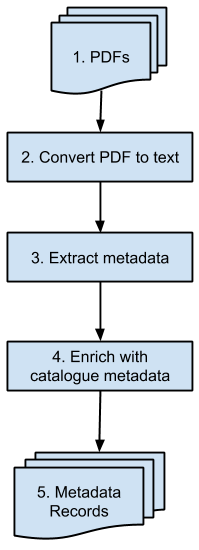
- Figure 4: Metadata Extraction Pipeline. Given a PDF, there are three main components invoked to produce a metadata record.

How well does the Solution Work?
Ok, enough with describing the tool, how well does it work? Well that’s a kind of a complicated question to answer. It depends on what you’re using it for. Different uses will have different requirements on the quality of the metadata extracted.
For example, if you want it to pull out perfect metadata so that you can use it to generate citations from Mendeley Desktop without having to make any manual corrections then you have pretty high quality requirements. If, however, you don’t need perfect metadata (e.g. the case of a letter may be wrong, a character in the title may be incorrectly extracted, the order of authors is incorrect) but need it to be good enough so that you can easily organise your research, then the quality doesn’t need to be so high. In this section, we’re going to consider the most strict case where the metadata extracted needs to be perfect so that it can be used to generate a citation.
We curated a data set of 26,000 PDFs for which we have perfect citable metadata records. This is our test data set. It’s large enough that it gives us a 99.9% level of confidence that the results from this evaluation would hold when tested against a much larger set of articles.
We then entered these 26,000 PDFs into our metadata extraction tool and found that 21,823 (83.9%) metadata records were generated with perfect, citable metadata: authors, title, year, and publication venue (e.g. journal, conference, magazine) (Figure 5). This means that 16.1% of PDFs either can’t be processed or return incorrect/incomplete metadata.

- Figure 5: Simplified Metadata Extraction Evaluation. Given 26K PDFs, the tool can produce citable metadata for 83.9% of them.

So that’s how well the metadata extraction tool works from a bird’s eye perspective. As we’ve already shown, however, the metadata extraction tool is a pipeline that chains together a number of different components. We should be able to go a step further and see how well the individual components in our pipeline are performing. These also act as useful machine diagnostics that help us to understand which components need to be improved first in order to improve the tool’s overall performance.
Let’s look at how many PDFs make it through each stage of the pipeline (Figure 6). First, we check whether the PDF is processable. That is, can we convert it to text. If we can’t then we don’t have any data to work with. In our tests, we were able to extract text out of 25,327 (97.4%) of the PDFs. This suggests that using a better PDF to text conversion tool could increase our overall performance by 2.6% which, compared to the 16.1% of PDFs that we didn’t get citable metadata for, isn’t that much.

- Figure 6: Metadata Extraction Pipeline Evaluation. Breakdown of how many PDFs are processed at each stage in the pipeline.

For the text that we could extract, we attempted to pull out the major metadata fields of title, authors, DOI, publication venue, volume, year and pages. In practice, not all PDFs will contain all these fields in the text but the vast majority should as publishers tend to include them. Whether they are in the PDF or not, we need to be able to find these fields in order to present them to the user for use as a citable record. In 23,961 PDFs (92%), we were able to extract out these metadata fields. This means that we lose another 5.3% of the total number of PDFs at this stage. This suggests that it may be more worthwhile improving the quality of the metadata extraction component over the PDF to text one. We can probe this further to see precisely which fields were extracted, and how accurately, but we’ll discuss this in a later blog post.
We can then query the Mendeley Catalogue with the 23,961 metadata records that we have extracted. Querying the catalogue enriches the extracted fields with additional metadata. For example, if we failed to extract the volume or the page numbers, the catalogue record may have this information. Here, 23,291 out of the 23,961 queries (97.2%) returned a result that allowed us to enrich the metadata. This suggests that the catalogue enrichment step is performing pretty well, but we can probe this further to determine the cause of the 2.8% of failed catalogue lookups (e.g. does the entry in fact not exist, or was the query too imprecise). In this step, we don’t lose any records as this is only an enrichment step. That is, out of the 23,961 metadata records extracted, we have now been able to enrich 23,291 of them but we don’t lose the remaining 670 records (23,961 – 23,291), they just don’t get enriched. Improving the catalogue lookup step would therefore, at most, allow us to enrich another 670 records, which accounts for 2.6% of the original 26,000 PDFs.
Finally, we evaluate the final number of PDFs that yield definitive, citable metadata. Out of the 26,000 PDFs tested, 21,823 (83.9%) have precisely correct metadata. We can see that out of the 16.1% of PDFs that we don’t get correct metadata for, there may be gains of 2.6%, 5.3% and 2.6% by improving the pdf to text tool, metadata extraction component and the catalogue lookup service respectively. In practice, more detailed diagnostics than these are needed to decide which component to improve next and we really need to take their relative costs into account too, but that’s a far more detailed conversation that we’ll go into here.
So we can see how the performance of various steps of the pipeline impact on the overall performance as experienced by you when you drop in a PDF and see (hopefully) a clean metadata record appear in your library.
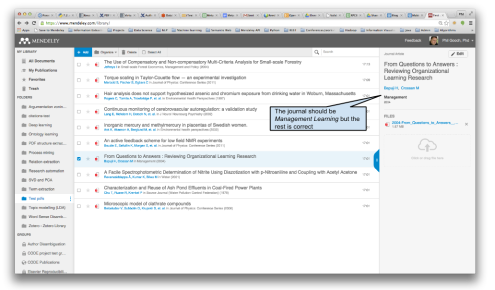
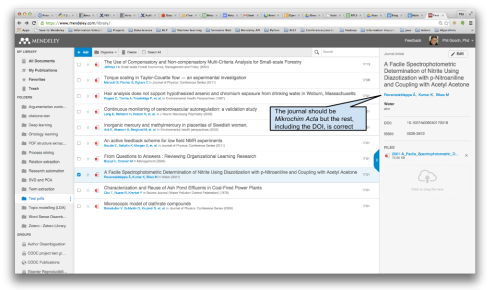
Examples
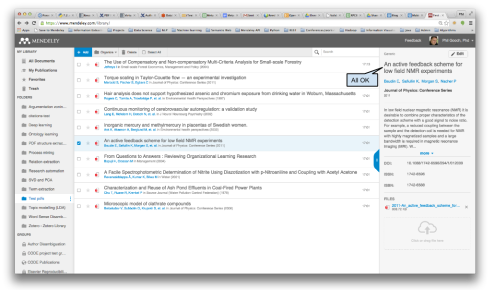
As a further demonstration of how well the metadata extraction tool works, here’s a selection of 10 randomly selected Open Access Journal article PDFs that we dropped into Mendeley Library and the metadata that was pulled out from each (Figures 7-16). A perfect citable metadata record is generated for 8/10 of the PDFs. In the two cases that fail, the publication venue was incorrect, whilst the other metadata was correct. As a result, you would have to manually correct these two fields before using them to generate citations. This test of our random sample of 10 articles fits with our prediction that 8-10 metadata records created should have perfect citable data.

- Figure 7: Metadata Extraction Example 1

- Figure 8: Metadata Extraction Example 2


- Figure 9: Metadata Extraction Example 3


- Figure 10: Metadata Extraction Example 4

- Figure 11: Metadata Extraction Example 5

- Figure 12: Metadata Extraction Example 6

- Figure 13: Metadata Extraction Example 7


- Figure 14: Metadata Extraction Example 8


- Figure 15: Metadata Extraction Example 9


- Figure 16: Metadata Extraction Example 10

Integrate Metadata Extraction into your own App
We have made this tool available through Mendeley’s Developer Portal meaning that you can integrate it into your own applications. So if you want to build an app that has the wow factor of built-in metadata extraction then go for it.
Conclusion
So, all in all, Mendeley’s metadata extraction tool works pretty well. If you drop 10 PDFs into your Mendeley Library then, on average, you’ll get perfect, citable metadata for 8-9 of them. There’s always room for improvement though so while we’re continually working on it, please feel free to help us move in the right direction by getting in touch with feedback directly.
Kris’ Acknowledgements
While this post was written by both Phil Gooch and myself, I wanted to add a private acknowledgements section here at the end. Everything we do Mendeley is a team effort but Phil Gooch is the main man to thank for this tool. He managed to put in place a high quality system in a short amount of time and it’s a unique offering for both the research and developer communities. Huge thanks.
We would both like to give a few shout outs for some key folks who made this project come to fruition – Kevin Savage, Maya Hristakeva, Matt Thomson, Joyce Stack, Nikolett Harsányi, Davinder Mann, Richard Lyne and Michael Watt. Well done all, drinks are on us!
Introduction
Everyone who spends time surfing the web comes into regular contact with both search engines and recommender systems, whether they know it or not. But what is it that makes them different from one another? This is a question that I’ve been asking myself more and more as of late so I thought that I’d start to put some of my thoughts down.
The Underlying Technologies
I know plenty of folk who begin to answer this question by saying that search engines and recommender systems are different technologies. In the early days of their development the people working on these systems split largely into two different communities, one of which focussed more on Information Retrieval and the other on Information Filtering. As a result, different avenues of research were pursued, which, despite some cross-fertilisation, shaped the fields, and resulting technologies, in different ways.
These two communities are increasingly coming back together as advances in search engines include lessons learned from Information Filtering techniques (e.g. collaborative search) and recommender systems start exploiting well established Information Retrieval techniques (e.g. learning to rank). As such, it’s becoming less relevant to distinguish search engines and recommender systems based on their underlying technologies.
So how should we distinguish them? I think that their primary difference is found in how users interact with them.
How to Spot a Search Engine
- You see a query box where you type in what you’re looking for and they bring back a list of results. From gigantic search engines like Google to the discrete search boxes that index the contents of a single page blog, they all have query boxes.
- You start with a query that you enter into a query box. You have an idea of what you’re looking for. That thing may or may not exist but if it does then you want the search engine to find it for you.
- You find yourself going back to reformulate your query as you see what results it gives and you widen or narrow the search.
- You may even generate a query by clicking on items that interest you (e.g. movies that you like). The search engine will then retrieve more movies for you.
How to Spot a Recommender System
- Some content has just appeared on your screen that is relevant to you but you didn’t request it. Where did that magic come from? That would be a recommender system.
- You don’t build a query and request results. Recommendations engines observe your actions and construct queries for you (often without you knowing).
- They tend to power adverts, which can give them a bad image, especially if the content is embarrassing.
Conclusion
Search Engines are not the same as Recommender Systems. Both can provide personalised content that matches your needs but it’s not what they do or the techno-magic that they use to do it but more how you interact with them that distinguishes them from one another.
Introduction

Last week, Mendeley hosted an all day workshop on Academic-Industrial Collaborations for Recommender Systems. As we’re fast running out of space in our London office, we rented a venue that was nearby named Headrooms. With a friendly staff, attentive to everyone’s needs and great start-up décor, I’d definitely rent it again. In the morning and early afternoon we were treated to seven talks from a variety of speakers who shared their experiences of academic-industrial collaborations and recommender systems. We finished the afternoon by splitting into smaller groups to discuss the challenges involved in making such collaborations a success and sharing useful advice with one another. The day then finished, as all good days do, with a quick trip to the funkily named Giant Robot, to taste some of their excellent cocktails.
Presentations
Seven presentations were delivered by our eight speakers, one of them being an entertaining double act. We tried to film as much of the event as we could so that we could share them with you afterwards.
First off, Jagadeesh Gorla began with a presentation entitled A Bi-directional Unified Model. Jagadeesh talked about the results presented in his www2013 paper on group recommendations via Information Matching, a new probabilistic model based on ideas from the field of Information Retrieval, which learns probabilities expressing the match between arbitrary user and item features: this makes it both flexible and powerful. He is currently working on developing an online implementation for deployment in an online gaming platform.
Our double act, Nikos Manouselis and Christoph Trattner then followed with the intriguingly entitled presentation Je T’aime… Moi Non Plus: Reporting on the Opportunities, Expectations and Challenges of a Real Academic-Industrial Collaboration. They gave an honest and candid reflection of their expectations for working together and how some of their past experiences in other collaborations weren’t as successful as hoped. It was great material that fed into the discussions later in the day.
Heimo Gursch then gave some Thoughts on Access Control in Enterprise Recommender Systems. While his project is still in the early stages, he had quite a few experiences that he could share from working with industry partners from the perspective of an academic. He was working on designing a system that would allow employees in a company to effectively share their access control rights with one another rather than relying on a top down authority to provide them. It’s also the first time that I’ve seen a presenter give his car keys to a member of the audience. I do hope that he got them back.
Maciej Dabrowski delivered an exciting presentation Towards Near Real-time Social Recommendations in an Enterprise. His team and him have been working on a cross-domain recommendation system that works in a federated manner. It exploits semantic data from linked data repositories to generate recommendations that spans multiple domains.
Mark Levy, from our team here at Mendeley, then presented some of the work that he has been doing in a talk entitled Item Similarity Revisited. The presentation was filled with useful advise from an industrial perspective on what makes a good recommender system. He also explored the idea that simple algorithms may be more useful than complex ones in an industry setting, showing some impressive results to back it up. I’ll include Mark’s presentation after his paper has been published.
Benjamin Habegger then took us on a rollercoaster ride exploring some of his successes and failures in his last startup, 109Lab: Feedback from a Start-up Experience in Collaboration with Academia. He reflected on his experience of co-founding a startup and what he learned from it. Although he worked with academia during the process, he wasn’t clear about the value that it actually brought.
Finally, Thomas Stone presented Venture Rounds, NDAs and Toolkits – Experiences in Applying Recommender Systems to Venture Finance. Thomas had some nightmare experiences with NDAs during his PhD. So much so, that he’s still unclear what he has the right to publish in his thesis. He also gave a nice introduction to PredictionIO, an open source machine learning server.
Discussion Groups
Once the presentations were given, everyone was invited think about the challenges and difficulties that they had faced in working in academic-industry collaborations and to write down some topics on a flip chart. We then split into three groups and, using these topics as guidance, discussed the issues faced and presented some solutions.
A number of issues were identified including:
- Prototypes vs roduction code – do the partners know what is expected from whom?
- How to find the right partners
- Access to data (e.g. NDA issues)
- Evaluating systems
- Best practices
After the three groups discussed the points we all gathered back to share our thoughts and conclusions. In general, we all seemed to share similar problems in making academic industry collaborations successful. We discussed that there should always be a clear set of expectations agreed from the outset and that partners should know their roles. Communication lines should be kept open and the spirit of collaboration encouraged. What’s more, it can help to have members of the teams working together in the same physical location, even if it’s just for a brief period, in order to work together well.
Conclusions
Working in academic-industrial collaborations is hugely rewarding but it can be tough. Finding the right partners who understand each other’s goals and constraints is important from the outset. We can all learn from one another but we need to put in some effort in order to enjoy the rewards.
I’d like to thank everyone who put in the effort to make the workshop a success and, as I follow up the several e-mails that I’ve got, hope to start to new and fruitful collaborations!
Workshop Date: 10 July 2013
Submission Date: 1st July, 2013
Location: Headrooms, 1-2 St John’s Path, London, EC1M 4DD
What is this Workshop?
Recommender systems are fast becoming as standard a tool as search engines, helping users to discover content that interests them with very little effort. Their commercial popularity has made them as hot a topic in industry as they are in academia. With this shared interest, conferences like ACM’s Recommender Systems often attract as many academics as industry practitioners. This workshop aims to bring local academics and industry practitioners together to share experiences and make new contacts.
This workshop provides a forum for researchers and developers alike to showcase their recommender system work and explore possibilities for new collaborations. We’re interested in fostering new links between academia and industry, providing academics with real-world environments in which to solve problems and industrial partners with access to some of the local area’s top academic researchers in the field. We’re also interested in hearing from researchers and developers who are currently or were previously involved in such collaborations, learning from what went well and not so well in their experiences.
Call for Presentations/Demonstrations
Researchers and developers from academia and industry are invited to give presentations in our 1-day workshop. We expect each presenter will have a total of 20 minutes to present and/or demonstrate their recommender system work which will be followed by 10 minutes of discussion. Topics of interest include, but are not limited to:
- Academic’s experiences of working with industry
- Industry practitioner’s experiences of working with academics
- Experiences of working with recommender system software libraries
- Experiences of testing recommenders offline
- Experiences of testing recommenders online
- Experiences of sharing data between academia and industry
If you would like to present, please contact kris.jack@mendeley.com with a short description of your presentation in no more than 300 words. Also, please let us know if you are already involved in any academic-industry partnerships. If so, what were the main challenges that you had in working together and how, if possible, did you overcome them? If not, are you seeking some partners? What would you like to get from the partnerships? This will help us to identify useful topics for our round table discussion.
Important Dates
Presentation Abstract Deadline: 1st July, 2013
Notification of Acceptance Deadline: 3rd July, 2013
Workshop Date: 10th July, 2013
Please let us know (kris.jack@mendeley.com) if you will attend the workshop whether you intend to give a presentation or not.
On receiving your abstract, we will get back to you within days as to whether we think that you’re presentation would be interesting for the workshop audience. So if you submit before 1st July, you can expect to receive a reply sooner than the notification deadline too.
Who is expected to attend?
Researchers and developers who work with recommender system technologies. We invite researchers who are working on novel solutions to some of the most challenging problems faced in recommender system research and industry practitioners who grapple with the challenges of developing recommender systems into products for real people to use. By bringing researchers and industry practitioners together for a day we hope that everyone will benefit from making new contacts in an open and friendly environment. We particularly encourage both researchers and industrial partners who have had previous experiences of academia-industry collaborations. As it is a one day event, we expect the audience to be quite local, made up mainly of participants from London and the UK although all are welcome.
Workshop Programme
9:00 Breakfast and coffee
9:20 Open workshop and welcome
9:30 Jagadeesh Gorla, A Bi-directional Unified Model
10:00 Break
10:20 Nikos Manouselis & Christoph Trattner, Je t’aime… moi non plus: reporting on the opportunities, expectations and challenges of a real academic-industrial collaboration
10:50 Heimo Gursch, Thoughts on Access Control in Enterprise Recommender Systems
11:20 Break
11:50 Maciej Dabrowski, Towards near real-time social recommendations in an enterprise
12:20 Mark Levy, Item Similarity Revisited
12:50 Lunch
14:05 Benjamin Habegger, 109Lab: feedback from a start-up experience in collaboration with academia
14:35 Thomas Stone, Venture Rounds, NDAs and Toolkits – experiences in applying recommender systems to venture finance
15:05 Break
15:25 Round table discussion on academic-industry collaborations
16:25 Break
16:45 Exploring possible collaborations
17:30 Drinks for all at Giant Robot!
Note: Presentation slots have 20 minutes for presentations followed by 10 minutes of discussion.
Accepted Presentation Abstracts
Maciej Dabrowski, Towards near real-time social recommendations in an enterprise
This work proposes a new perspective on near real-time social recommendations in enterprise social platforms based on the challenges we identified in a comprehensive survey of existing approaches as well as the enterprise social platforms. We explore how Linked Data techniques associated primarily with the Semantic Web can be applied in a Corporate Enterprise context to provide near real-time social recommendations. We draw from research and experimental experience along with practical experiences based on the Webex Social platform, which is modeled on three elements: people, communities, and information. We evaluate a number of potential recommendation and notification techniques before proposing a novel method for generating recommendations based on the concept of Spreading Activation in an enterprise social graph. Our approach considers multiple information sources and is based on an experimental demonstrator using data from DBPedia and other sources. The proposed method allows for dynamic inclusion of additional information sources with very low effort, significantly improving recommender flexibility. Furthermore we define a system and architecture capable of making recommendations in near real-time whereas the majority of existing recommendation systems focus on a pre-compute preparation of results. This is critical in enterprise environments where informational events but more importantly their context and meaning is time critical. The architecture that we propose may be deployed in a standalone mode or as an integral part of an enterprise social software platform. We highlight how our approach improves the management of knowledge and communication within organization through more effective exploitation of information available in the corporate social web.
In addition to the contribution of this architecture and system which contains a novel approach for enterprise social recommendations we also propose the extension of certain IETF and W3C standards, namely the eXtensible Messaging and Presence Protocol (XMPP) and Semantic Processing And RDF Query Language (SPARQL) respectively.
Jagadeesh Gorla, A Bi-directional Unified Model
The underlying problem of recommender systems is to present a user with a set of relevant items (products, ads, people, research papers, etc.). The simplest way to look at it as the problem of estimating the probability of relevance between the user-item pairs and ranking them based on the probability. Even though it seems simple, it poses a difficult challenge on how to utilise the available information about the users, items, and the interactions between various user-item pairs in estimating the relevance. A simple example would be, in collaborative filtering we only have information on the user-item interactions (clicks, ratings, etc.). Sometimes, we may only have user, product description but not the interactions (e.g., age, product_type). We may have both (e.g., Xbox Live!). And, it is desirable to use the available information in estimating the relevance.
The common approach to solve the problem is based on Matrix Factorisation (MF). MF assumes a common feature (factor) space between the user, item and then these factors are estimated based on the interaction between users-items. In MF, there is no straightforward approach to incorporate native features of user, product (e.g., age, location) unless modelled as users/items.
I will present a unified model that (a) does not compute explicit similarity (like in K-nearest neighbourhood), (b) does not assume common feature space (like in MF) and (c) models users/items with interpretable features (as opposed to hidden), uses all the available information. And, can be used for building large-scale personalised systems in recommendation & search.
Benjamin Habegger, 109Lab: feedback from a start-up experience in collaboration with academia
In this presentation I will talk about my experience as CTO of 109Lab, my first start-up launched with 2 associates, Laurent Assouad and Bastien Marot. The goal of 109Lab was providing a “Big Memory” service helping people sort out, share and print the best of their digital memories (pictures, videos, notes, etc.). Our target business model was primarily based on selling photo-products based on these memories. Since the beginning of the project, we had the will to work in connection with scientific research, in particular due to my background as a researcher. Therefore, we directly started off with a collaboration with researchers of the LIRIS Laboratory at the INSA of Lyon. The work we lead with the LIRIS was studing how semantically enriching digital memories with contextual information (e.g. exif, spacio-temporal meta-data) could help sorting, organizing and creating stories with these memories. Among this work, we investigated how we could use user-action logs to recommend future actions based on what other user’s had done in the past in a similar context. To help the user sort his memories, clustering and classification techniques were envisaged. After a two year experience, launching two services Blaboum.com and OhMyToast.com, working on a seemingly hot topic for many people, gaining quite some notoriety within both the research and entreprenship communities in Lyon, we decided to stop for different, likely entangled, reasons. Far from a real failure, this experience has been very rich in lessons on which I am now building upon. This talk will be about this experience, the difficulties in making the mixture take, my view of the possible reasons it did not take for us, feedback on mixing academia with a start-up project but mostly why it was really worth trying and why I am likely to do so again!!
This talk presents a project that the Know-Center is working on with the Virtual Vehicle and four large German automotive companies. This project is set in the engineering domain of these automotive companies. The current solution of the information gathering process is unsatisfying for their employees. Due to the diverse and heterogeneous nature of their data services, it is hard for them to find what they need. Strict company policies controlling access to the data make the situation even worse. Enterprise search solutions that are currently available are no satisfying solution, since they are hardly used when introduced in the companies.
The proposed solution consists of a deep integration of recommender systems and the access control scheme that is applied. This presentation focuses on possible solutions to their problems and why information technology alone cannot solve all the issues. Starting with an overview of the current situation at our partner’s, the presentation will continue with aspects of access control as well as the recommender system.
Nikos Manouselis & Christoph Trattner, Je t’aime… moi non plus: reporting on the opportunities, expectations and challenges of a real academic-industrial collaboration
This presentation will be a live exchange of ideas & arguments, between a representative of a start up working on agricultural information management and discovery, and a representative of academia that has recently completed his PhD and is now leading a young and promising research team.
The two presenters will focus on the case of a recommendation service that is going to be part of a web portal for organic agriculture researchers and educators (called Organic.Edunet), which will help users find relevant educational material and bibliography. They currently develop this as part of an EU-funded initiative but would both be interested to find a way to further sustain this work: the start up by including this to the bundle of services that it offers to the users of its information discovery packages, and the research team by attracting more funding to further explore recommendation technologies.
The start up representative will describe his evergoing, helpless and aimless efforts to include a research activity on recommender systems within the R&D strategy of the company, for the sakes of the good-old-PhD-times. And will explain why this failed.
The academia representative will describe the great things that his research can do to boost the performance of recommendation services in such portals. And why this does-not-work-yet-operationally because he cannot find real usage data that can prove his amazing algorithm outside what can be proven in offline lab experiments using datasets from other domains (like MovieLens and CiteULike).
Both will explain how they started working together in order to design, experimentally test, and deploy the Organic.Edunet recommendation service. And will describe their expectations from this academic-industry collaboration. Then, they will reflect on the challenges they see in such partnerships and how (if) they plan to overcome them.
Thomas Stone, Venture Rounds, NDAs and Toolkits – experiences in applying recommender systems to venture finance
Academic-Industrial Collaborations – I am undertaking research with a venture capital firm called Correlation Ventures and applying information retrieval techniques to areas such as industry classification, peer/competitor identification and matching investors with private companies. Due to the nature of the data I am working with there have been extended delays in terms of getting agreements (NDAs) and receiving datasets (anonymizing, 3rd party consent). Previously I had faced several challenges (availability, privacy, IP issues) in finding suitable industry partners and have a handful experiences to share.
Tools for Researchers – I have had experience working with several different toolkits and libraries for applying recommender systems and machine learning (MyMediaLite, LibFM, RapidMiner, Python (SciPy, NumPy, scikit-learn), SVDFeature). I am also now involved with an open-source project PredictionIO targeted at developers who want to build scalable predictive features in their own applications (content discovery, recommendation, personalization). I would be happy to share my experiences both positive and negative on my experience using these different tools as a research student.
Mark Levy, Item Similarity Revisited
The announcement of the Netflix Prize back in 2006 saw the start of a rush to develop novel methods for preference prediction based on collaborative filtering of ratings, a theme which continues to be pursued to this day in academic circles. The impact of rating prediction methods on industry, however, is unclear. Netflix themselves commented on their tech blog in 2012 that rating predictions formed only a single (and relatively uninfluential) input feature to the ranking models which they actually use to generate recommendations. Meanwhile several other industry players, particularly those whose datasets contain only implicit feedback and not ratings, are known still to use simple item similarity methods as the basis of their recommender systems.
Item similarity methods offer fast computation at recommendation time, and natural explanations of why particular items are being recommended, but they have not been a focus of academic research, except as benchmarks which can apparently be easily beaten by more complex algorithms, perhaps because item similarity tends to give high quality recommendations only when carefully tuned for a particular dataset. An interesting paper from 2012 bucked the trend by introducing Sparse Linear Methods (SLIM), and showing that they easily outperformed more complex preference prediction models for top-N recommendation, but at rather a high computational cost compared to traditional item similarity methods when applied to large datasets.
In this presentation I show experimental results which suggest that a simple relaxation of the problem constraints solved by SLIM can lead to an item similarity method which outperforms model-based algorithms but at reasonable computational cost. I put this in the context of some reflections on the reality of running large-scale industrial recommender systems based on experience at Last.fm and Mendeley.
Why is Mendeley Hosting this Event?
Mendeley employs recommender systems technologies to help researchers organise their research, collaborate with one another and discover new research. We have an in-house team of R&D engineers and Data Scientists who collaborate with academics in four European funded international research projects. One of these projects is the TEAM project (http://team-project.tugraz.at/), a research project funded by the European Commission in FP7 in the context of the Industry- Academia Partnerships and Pathways (IAPP) Action within the Marie Curie Programme. The TEAM project is sponsoring this event, encouraging collaborations to form between academia and industry.
Where is the Event?
The event will take place in Headrooms, 1-2 St John’s Path, London, EC1M 4DD (map).
If you have trouble finding the venue, from Britton Street, look for the Jerusalem Tavern and you should see the arch that leads to St John’s Path (see pictures below).


Introduction
Mendeley’s 80 million+ research catalogue most likely covers all of the topics that have ever been worked on in research. What are these topics though and how do we go about finding them? In my previous post, I looked at these topics from the perspective of recognised academic disciplines and found that the catalogue’s main topics are Biological Sciences, Mathematics and Computer and Information Science. That’s a familiar set of topics for us to see and gives us an idea of the catalogue’s content. I wonder, however, if there’s a set of topics that more naturally describes the catalogue, without being constrained to fit in these disciplines that we already know.
In this post, I’d like to explore this idea through the application of a machine learning model named Latent Dirichlet Allocation (LDA). Given a set of articles, LDA attempts to automatically find the topics that run through them. I’ll start by describing LDA in a little more detail before comparing some of the implementations of this technique that are available to download. I’ll then show, as a starting point, how to use LDA to find topics in one of the most read fields in Mendeley’s catalogue, Computer and Information Science, leaving finding topics in the entire catalogue to a future post. Given that we already know the article classifications in sub-disciplines for this field (again, see Part 1 in this series of posts), I’ll compare how similar they are to the topics found by LDA. Ok, enough of the preliminaries, let’s get started.
What’s LDA
LDA is a model that has often been applied to large collections of articles in order to find the topics that run through them. It draws on our intuition that articles can cover several different topics to a greater or lesser degree. Similar to the previous post, where an article can appear in several disciplines/sub-disciplines, LDA assumes that several topics can appear in articles too. Unlike in the previous post, however, where topics of academic disciplines and sub-disciplines were predefined by human experts, LDA does not require topics to be defined from the outset. Instead, the algorithm attempts to find topics that do a good job of accounting for the words in the articles.So if we don’t start out with topics then what do the topics that LDA comes up with look like? Topics created by LDA are a distribution of words. For example, LDA may come up with two topics when describing Computer and Information Science articles that are associated with software and hardware respectively (Table 1). It will be able to give a score to each of the words in a topic to describe how important the word is to the topic (note that scores are not illustrated in the table for simplicity). It can also describe how important each of these two topics are to a given article, based on the words that appear in the article. LDA therefore generates two outputs: a list of topics that are each word distributions; and the importance of each topic to a list of articles.
| Topic 1 (software) | Topic 2 (hardware) |
|---|---|
| software | computer |
| game | processor |
| code | keyboard |
| programmer | printer |
| program | hardware |
From a linguistic perspective, it is interesting to look at this kind of computational modelling as a step towards expressing the semantics in an article. Language employs both syntax (i.e. words and rules) and semantics (i.e. meanings). When you write an article, you take an idea and express it through the words in a language in an attempt to convey a meaning. In other words, articles allow for the transmission of semantics through the medium of syntax. Syntax is all that a computer model has to work with. The topics that LDA pulls out, however, tend to invoke a coherent meaning when you read them. It’s almost as if the model is chipping away at the syntax in order to expose the underlying semantics. I find it pretty neat to think of it like that.
In probability and statistics LDA gets referred to as a generative model. If you’d like to read more about LDA then these articles are a great place to start:
- Blei, D. M., Ng, A. Y., & Jordan, M. I. (2003). Latent Dirichlet Allocation. The Journal of Machine Learning.
- Griffiths, T. L., & Steyvers, M. (2004). Finding scientific topics. Proceedings of the National Academy of Sciences of the United States of America, 101 Suppl , 5228–35.
- Blei, D. (2010). Probabilistic Topic Models. IEEE Signal Processing Magazine, 77–84.
LDA Libraries
Data Selection and Preparation
Running LDA
There are a few steps in running Mr. LDA. First off, we need to parse our articles to prepare them for the modeller. Then hold some of them back, say 10%, so that we have something with which to evaluate the model once it’s trained. Then we train some models on the remaining 90% of articles, selecting a different number of topics for each one. Finally, we test how good each of our models are using the 10% held back articles to see how many topics we should consider. Let’s go through those steps in more detail.First step is to parse the articles. Mr. LDA encourages us to think of a couple of important points at this stage. Every word that appears in an article can potentially appear in a topic. We don’t need to include words that are very common to our articles though. These words will give the model more work to do and will not really help it to make useful topics. Similarly, we should also think about removing words that appear too rarely. If a word only appears once then it’s not going to be very useful for making topics. In this setup, I looked at the frequency distribution of the words in my 100,000 articles. In total, there were 109,712 unique words. From looking at the words sorted by frequency, I decided to remove words that appeared in more than 10% and less than 1% of the articles. 74 unique words appeared in too many articles and 97,484 unique words appeared in too few articles. This leaves 12,228 unique words.
Next we split the articles into a 90% (i.e. 90,000) training set and a 10% (i.e. 10,000) testing set. It’s good practice to split a corpus into a training set and a testing set. Once a model learns topics for the set of training articles, it can then be tested on the testing set to see how well it accounts for them. Since it has not been exposed to the testing set during training, this gives us an idea of how generalisable the learned model is to new articles.
The next step is to a start training some models. Mr. LDA, as with several implementations of LDA, requires that you provide the number of topics that are to be learned from the outset of training. Choosing the correct number of topics is somewhat based on experience so don’t be afraid to experiment. Since you have training and testing data sets you’ll be able to validate just how well a particular number of topics generalises to new data. To kick things off, I first decided to run training with five topics, increasing it to 10, 20, 30, 40, 50 and then 100. I ran each of the training sessions for 40 iterations which tends to give reasonably good results for Mr. LDA’s brand of LDA, variational approximation for Bayesian inference.
Mr. LDA allows you to take a model that has previously been learned and to test how well it generalises to another set of articles. Once each model was trained, it was tested. The output of testing a model on a set of articles is expressed as a log likelihood value. The higher the value, the better the model’s likelihood of describing the data. Don’t worry too much about the actual value produced. Instead, compare the values produced across different models that you have tested to find out which one is a best fit for the article. You will probably find different likelihood values for models that are trained to learn a different number of topics. This will help you decide how many topics are in your articles.
The log likelihood values produced by testing these nine models learned, shows that it changes depending upon the number of topics (Figure 1). We can see that the peak appears between 20 and 25 topics, with 25 topics being slightly more likely.

Figure 1: Likelihood for 5, 10, 15, 20, 25, 30, 40, 50 and 100 topics.
Topics
The 25 topics that were learned by Mr. LDA are summarised in Tables 2-6. Note that the words appear in their stemmed forms due to the stemming performed in the preprocessing steps. For example, the word increase appears in the tables as increas, indicating that it has been stemmed. The top 15 words from each topic are shown, ordered by probability, with the most probable appearing higher up in the list. The implementation of LDA used did not give the topics names so I tried to add some myself, shown in brackets after the topic number. When I couldn’t think of an appropriate name I added a question mark. I couldn’t think of names for 6 out of 25 of the topics.
| Topic 1 (?) | Topic 2 (internet) | Topic 3 (programming & hardware) | Topic 4 (image processing) | Topic 5 (security) |
|---|---|---|---|---|
| organ | file | program | imag | signatur |
| loss | tcp | code | segment | vessel |
| weld | increas | parallel | signal | malwar |
| site | laser | memori | filter | ultrasound |
| crack | determin | game | detect | botnet |
| determin | segment | execut | video | arteri |
| wavelength | clock | hardwar | region | fractur |
| resid | surfac | fault | nois | detect |
| forens | smooth | power | code | lip |
| panel | sensor | architectur | estim | flow |
| form | target | processor | color | beat |
| growth | shadow | run | frequenc | coronari |
| element | remov | dynam | channel | materi |
| optic | charact | circuit | error | blood |
| observ | coat | reduc | surfac | deform |
| Topic 6 (genetics) | Topic 7 (e-publishing & e-commerce) | Topic 8 (software engineering) | Topic 9 (?) | Topic 10 (genetics) |
|---|---|---|---|---|
| sequenc | blog | product | watermark | gene |
| gene | blogger | architectur | ambient | protein |
| protein | vein | agent | auction | plant |
| alloi | rate | integr | fire | sequenc |
| laser | asl | project | nest | immun |
| express | increas | busi | forest | dna |
| weld | bicycl | framework | embed | express |
| dna | ebxml | tool | uma | speci |
| surfac | lesion | resourc | bid | genom |
| acid | sign | qualiti | sistema | yield |
| increas | lp | engin | ma | content |
| amino | cosmic | compon | handwrit | grain |
| radix | investig | cost | información | biolog |
| mutat | clerk | context | crash | genet |
| dental | dermoscopi | plan | digit | clone |
| Topic 11 (e-learning/e-education) | Topic 12 (HCI) | Topic 13 (networks) | Topic 14 (?) | Topic 15 (?) |
|---|---|---|---|---|
| learn | interact | node | group | weld |
| social | behavior | mobil | collect | stress |
| knowledg | visual | sensor | concentr | crack |
| student | human | wireless | conduct | temperatur |
| practic | interfac | protocol | garbag | materi |
| librari | event | rout | found | metal |
| articl | speech | traffic | water | laser |
| educ | virtual | scheme | correl | mechan |
| univers | physic | energi | combin | measur |
| scienc | task | layer | forecast | surfac |
| review | activ | packet | energi | fractur |
| author | displai | delai | measur | element |
| year | subject | access | chines | forc |
| public | cognit | link | translat | load |
| digit | measur | power | polici | field |
| Topic 16 (security and privacy) | Topic 17 (health care) | Topic 18 (body and health care) | Topic 19 (robotics) | Topic 20 (information retrieval & semantic web) |
|---|---|---|---|---|
| secur | patient | ecg | robot | web |
| attack | health | weld | track | languag |
| trust | medic | arsen | recognit | semant |
| protocol | care | group | human | document |
| protect | clinic | heart | motion | queri |
| privaci | treatment | laser | face | search |
| kei | diseas | bone | learn | retriev |
| authent | ag | signal | detect | databas |
| detect | cancer | increas | posit | ontolog |
| scheme | diagnosi | breath | visual | text |
| access | children | dev | sensor | content |
| polici | hospit | seizur | map | knowledg |
| vulner | year | ventricular | camera | word |
| intrus | breast | cardiac | vision | domain |
| encrypt | group | atr | locat | relat |
| Topic 21 (bio + chem + phys) | Topic 22 (algorithms) | Topic 23 (?) | Topic 24 (?) | Topic 25 (machine learning) |
|---|---|---|---|---|
| cell | optim | color | burst | learn |
| activ | estim | gamut | bond | predict |
| temperatur | space | guitar | menu | classif |
| water | graph | weld | song | pattern |
| mass | paramet | rate | mutat | train |
| star | solut | amp | mutant | classifi |
| concentr | point | increas | music | class |
| acid | measur | concentr | observ | rule |
| protein | approxim | low | ob | neural |
| magnet | search | activ | myocardi | select |
| compound | linear | ey | optic | fuzzi |
| increas | obtain | condit | region | cluster |
| observ | size | metal | content | accuraci |
| chemic | local | quantum | loci | machin |
| alpha | constraint | rat | coronari | decis |
Comparing LDA’s Topics with Academic Disciplines
LDA generated 25 topics describing the 90,000 Computer and Information Science articles. How do these topics compare with the human created discipline classification for the same field? Taking each of LDA’s topics, I compared them one by one, with the academic disciplines, attempting to find similarities and differences between their meanings. In some cases, topics matched up to each other pretty well, having roughly equivalent scopes, in others they shared a subset-superset relationship (i.e. one topic was more focussed than the other) while in other cases there was no obvious overlap (Figure 3). Note that during the discussion, I’ll use capital letters when referring to discipline topics and lower case letters for LDA derived topics.

Figure 3: Comparison of sub-disciplines and topics derived from LDA for the field of Computer Science
12 out of 21 academic topics have good matches in terms of meaning with 13 of the 25 LDA topics. Four topics from each set of topics match very well with one another having similar meanings and scope. These topics are computer security, networks, human-computer interaction and software engineering. It’s good to see such nice matches between the two topic groupings. It gives us confidence that LDA is working well and encourages us to explore all the topics that it has generated in more detail.
Algorithms, Artificial Intelligence, E-commerce, E-publishing, Graphics, Information Retrieval, Neural Networks and Programming Languages all have LDA topics that match up to them reasonably well but with less well matching scopes as the previous three topics. For example, the academic disciplines of Artificial Intelligence and Neural Networks match most closely to the LDA topics of robotics, image processing and machine learning. Artificial Intelligence normally covers both robotics, image processing and machine learning. It makes me question if Neural Networks and Artificial Intelligence should appear in the same discipline classification or not. I tend to think of Neural Networks as a subset of Artificial Intelligence rather than living at the same level. Also, the LDA results make me wonder if Artificial Intelligence should be represented as the specialisations of robotics, image processing and machine learning. If these are the three topics of Artificial Intelligence that are most published then perhaps our classification system should reflect it.
As a second example of topics with slightly different scopes, I now turn to Information Retrieval and information retrieval & semantic web. Clearly, the LDA topic is a superset of the discipline. It could be that the semantic web fits naturally in the Information Retrieval discipline and that I made it explicit when naming the LDA topic. By representing these two subjects in the same topic, LDA shows that they are similar to one another. This is intuitively appealing as much research on the semantic web stems from work in information retrieval.
Not all topics match up with one another. LDA found two topics that refer to genetics, a subject that doesn’t appear in the academic discipline classification. Undoubtedly, there is much collaboration between computer science and genetics researchers, creating quite a vibrant field of cross-disciplinary research. It’s useful to see this reflected in LDA’s topics. Similarly, there are topics of health care and body & health care that also highlight cross-disciplinary research between computer science and health care researchers. There is also a field on bio & chem & phys. This topic was difficult to name since the words in it are so mixed. Perhaps, as such, it’s difficult to say much more about this topic than the fact that because it originates from a corpus for articles in the discipline of Computer and Information Science, it highlights that there is much cross-disciplinary research conducted between these fields.
There is one more topic that LDA generated that I think deserves some attention. The topic of e-learning/e-education has attracted increasing attention from researchers as of late but doesn’t appear in the academic discipline classification. I think that this is a good example of classification schemes needing to be updated. The academic classification scheme, as good as it is, will inevitably have to be updated in order to reflect the changing topics in research. LDA, being supplied not only with articles from decades gone by but also with articles that were just published in the last month, is able to come up with topics that are up-to-date. We should use the LDA generated topics to help inform the process of updating the academic discipline classification and make sure that it provides useful and relevant categories for modern researchers.
Conclusions
In future posts, I’d like to look at what Latent Dirichlet Allocation can tell us about other disciplines in Mendeley’s catalogue and eventually look at the entire catalogue as a whole. The techniques and library used here all scale up well to very large collections of data. I’ll also consider a set of tools that can be built using LDA’s topics to further help researchers with their work.
